MMI Holdings | Semi-Annual December Interim Report
Advancing Client Centricity
Advancing Client Centricity 2016 interim results For the six months ended 31 December 2015
Agenda External environment Group strategy Financial results Capital management Critical focus areas
External environment - International Growth-negative • Slower global economic growth • Chinese shift to services economy • Reduced attractiveness of emerging markets • Fragile global trade activity Growth-negative for commodity-based economies
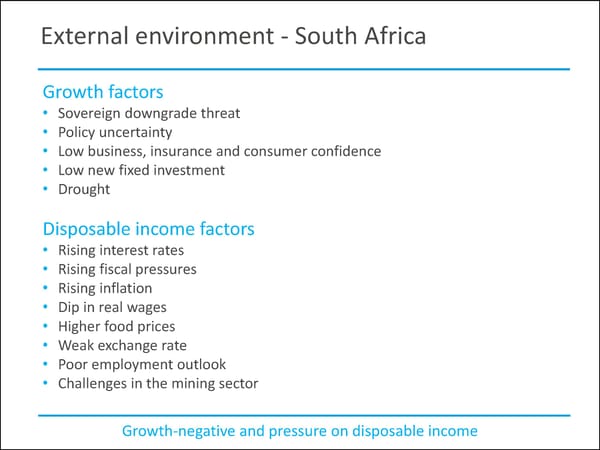
External environment - South Africa Growth factors • Sovereign downgrade threat • Policy uncertainty • Low business, insurance and consumer confidence • Low new fixed investment • Drought Disposable income factors • Rising interest rates • Rising fiscal pressures • Rising inflation • Dip in real wages • Higher food prices • Weak exchange rate • Poor employment outlook • Challenges in the mining sector Growth-negative and pressure on disposable income
External environment Volatile equity market -2.1% 1H2015 2H2015 1H2016 JSE All Share Index -2.3% +4.1% -2.1%
External environment Increasing bond yields – increased risk discount rate +140bps 1H2015 2H2015 1H2016 Risk discount rate -30bps +40bps +140bps
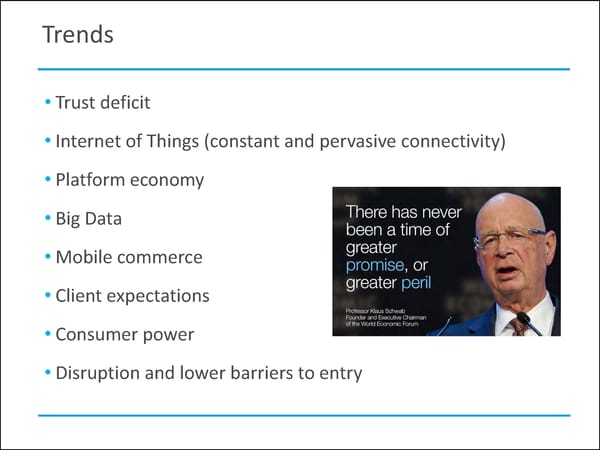
Trends • Trust deficit • Internet of Things (constant and pervasive connectivity) • Platform economy • Big Data • Mobile commerce • Client expectations • Consumer power • Disruption and lower barriers to entry
Agenda External environment Group strategy Financial results Capital management Critical focus areas
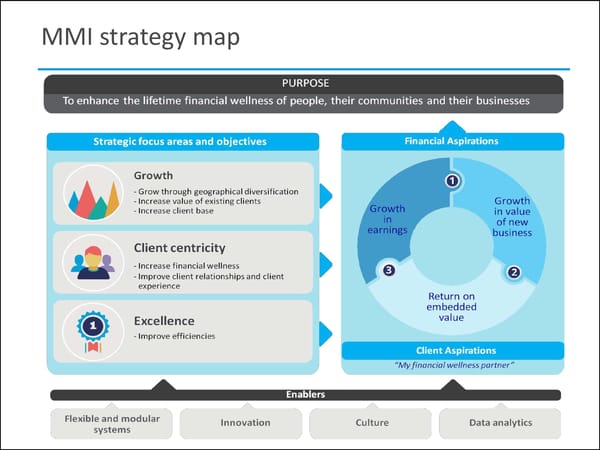
MMI strategy map
External environment - South Africa Financial wellness challenges for SA Households
MMI strategy MMI Purpose To enhance the lifetime financial wellness of people, their communities and their businesses
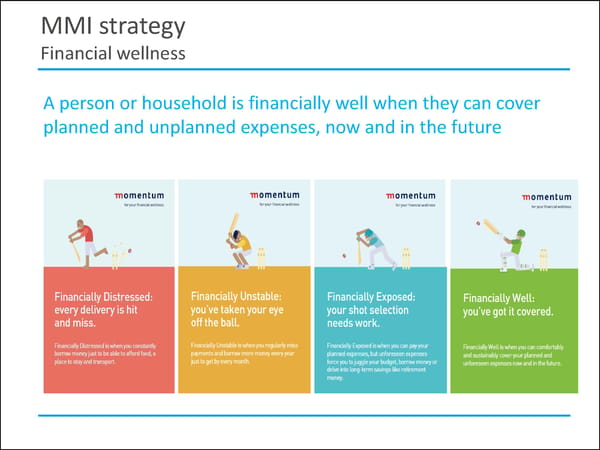
MMI strategy Financial wellness A person or household is financially well when they can cover planned and unplanned expenses, now and in the future
Financial aspiration Maximise shareholder value Return on embedded value 18.0% 16.0% Aspirational +6% 14.0% Threshold +3% Supported by Growth in 12.0% Growth in value of Risk-free rate earnings new 10.0% business 8.0% 6.0% Improve efficiencies 4.0% 2.0% 0.0% 100.0% 200.0% 300.0%
Strategic focus areas Growth Client centricity Excellence
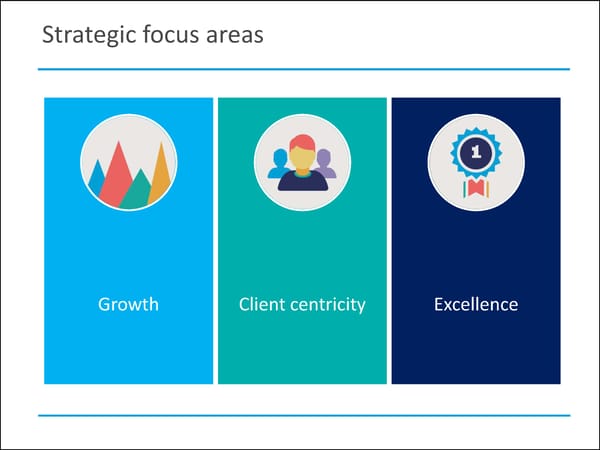
Strategic focus areas Growth • Growth through geographical diversification • Increase value of existing clients • Increase client base Client centricity • Increase financial wellness • Improve client relationships and client experience Excellence • Improve efficiencies
Strategic focus areas - Growth Growth through geographical diversification • India • Africa • UK Increase value of existing clients • Multiply Wellness & Rewards • Cross-product holdings • Short-term insurance Increase client base • Middle market • Channel growth • Corporate transactions (M&A) • Affinity market
Strategic focus areas - Growth Metropolitan Agent Productivity – per week
Strategic focus areas - Growth Momentum APE contribution per channel 100% 90% 23% 29% 28% 33% 80% 37% 36% 70% 60% 34% 30% 33% 25% 16% 19% 50% 40% 30% 20% 43% 42% 42% 47% 45% 38% 10% 0% F2011 F2012 F2013 F2014 F2015 F2016 Independent Brokers Corporate Brokers MMI Channels
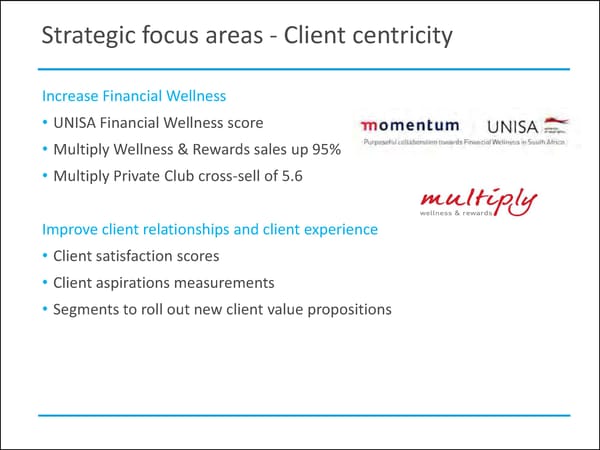
Strategic focus areas - Client centricity Increase Financial Wellness • UNISA Financial Wellness score • Multiply Wellness & Rewards sales up 95% • Multiply Private Club cross-sell of 5.6 Improve client relationships and client experience • Client satisfaction scores • Client aspirations measurements • Segments to roll out new client value propositions

Strategic focus areas - Client centricity Improve client relationships Client experience, wellness and rewards
Strategic focus areas - Excellence Improve efficiencies • Client-centric operating model enhancing efficiencies • Annual savings target of R750m by FY2019
Strategic focus areas - Excellence Group-wide optimisation projects
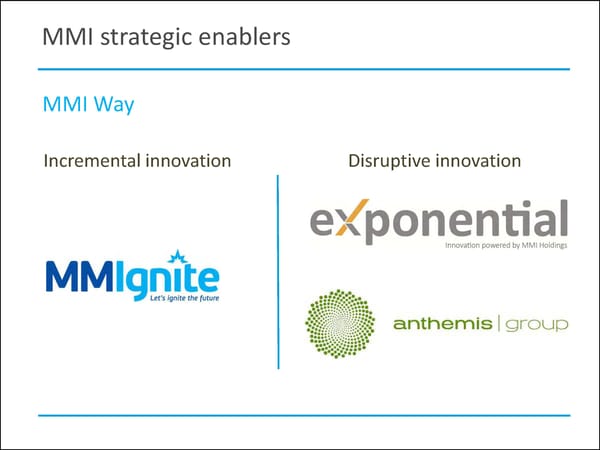
MMI strategic enablers MMI Way Incremental innovation Disruptive innovation
Agenda External environment Group strategy Financial results Operational results Critical focus areas
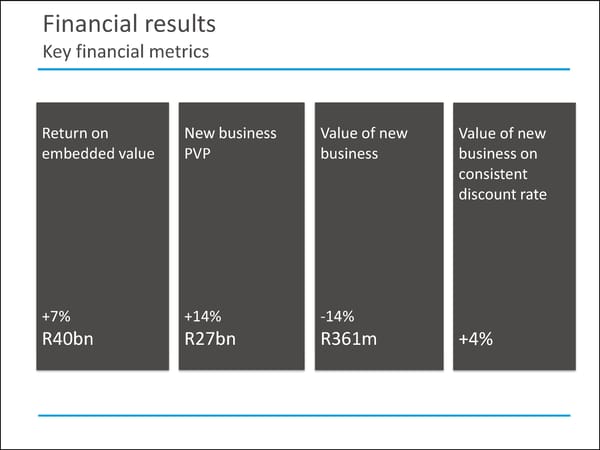
Financial results Key financial metrics Return on New business Value of new Value of new embedded value PVP business business on consistent discount rate +7% +14% -14% R40bn R27bn R361m +4%
Financial results Key financial metrics Diluted earnings Diluted core Interim dividend headline earnings +14% -9% +3% R1.5bn R1.7bn 65cps
Financial results Diluted core headline earnings per segment 1 year Dec 2014 Dec 2015 change Rm Rm Momentum Retail 745 705 (5)% Metropolitan Retail 273 311 14% Corporate and Public Sector 377 379 1% International 62 31 (50)% Segment results 1 457 1 426 (2)% Shareholder capital 395 253 (36)% Total 1 852 1 679 (9)% Profits impacted by underwriting experience
Financial results Total earnings (diluted) 1 year Dec 2014 Dec 2015 change Rm Rm Core headline earnings 1 852 1 679 (9)% Amortisation of intangibles (330) (373) Fair value gains (73) 265 Basis changes and investment variances (25) (68) Other adjustments (61) (74) Headline earnings 1 363 1 429 5% Other adjustments – Sale of subsidiary (3) 115 Diluted earnings 1 360 1 544 14% Solid increase in diluted earnings
Financial results Investments in strategic growth initiatives Dec 2014 Dec 2015 Rm Rm Core headline earnings as reported 1 852 1 679 Additional investments in growth initiatives 254 283 Momentum Retail Metropolitan Retail Corporate and Public Sector International Shareholder capital Percentage of core headline earnings 14% 17% Investments impacted overall profit growth
Financial results Impact of underwriting experience Dec Dec 1 year 2014 2015 change Rm Rm Core headline earnings as reported 1 852 1 679 (9)% Less: Life insurance underwriting experience 267 21 Adjusted core headline earnings 1 585 1 658 5% Less: Non-life underwriting profit 87 41 Core headline earnings before underwriting 1 498 1 617 8% Profit growth restricted by higher claims
Financial results Total life insurance Mortality and Morbidity experience – full year 600 500 400 300 200 100 0 FY2011 FY2012 FY2013 FY2014 FY2015 1H2016 Significant reduction in underwriting profits
Financial results MMI Retail insurance Mortality and Morbidity experience 400 350 300 250 200 150 100 50 0 FY2011 FY2012 FY2013 FY2014 FY2015 1H2016 Significant reduction in underwriting profits
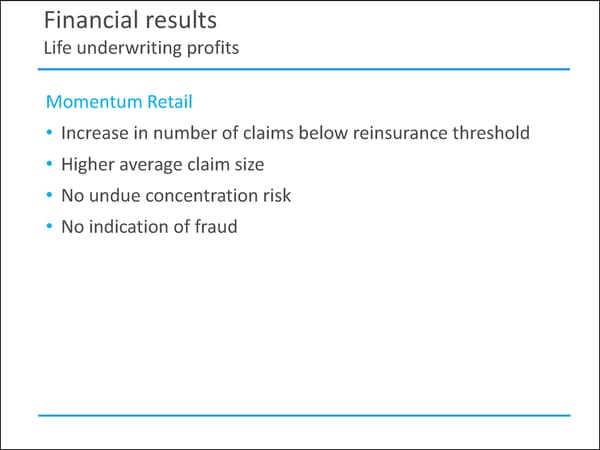
Financial results Life underwriting profits Momentum Retail • Increase in number of claims below reinsurance threshold • Higher average claim size • No undue concentration risk • No indication of fraud
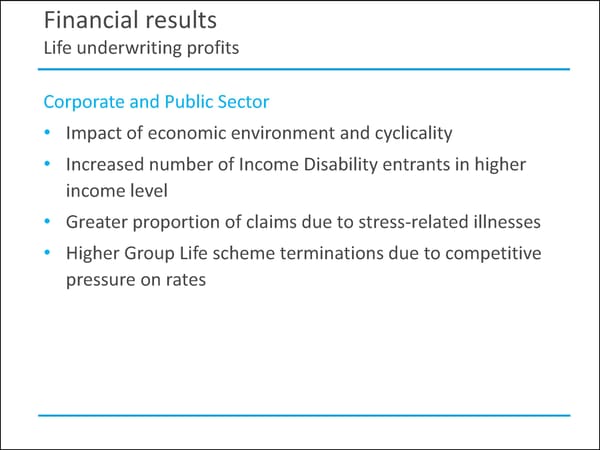
Financial results Life underwriting profits Corporate and Public Sector • Impact of economic environment and cyclicality • Increased number of Income Disability entrants in higher income level • Greater proportion of claims due to stress-related illnesses • Higher Group Life scheme terminations due to competitive pressure on rates
Financial results New business per segment 1 year Dec 2014 Dec 2015 change Rm Rm Momentum Retail 11 817 12 673 7% Metropolitan Retail 2 684 2 411 (10)% Corporate and Public Sector 8 369 10 921 30% International 975 1 265 30% Total PVP 23 845 27 270 14% Total APE 3 126 3 473 11% Strong growth in a difficult market
Financial results Value of new business attribution Rm 450 +4% 400 -75 350 19 -12 12 -20 28 300 421 346 361 250 200 Dec-14 Economic Revised Dec-14 Other Expenses Mix & Volumes Mortality & Dec-15 persistency Growth on a consistent economic basis
Financial results Value of new business per segment Dec Dec Dec 1 year 2014 2014 2015 change Rebased Rm Rm Rm Momentum Retail 127 104 126 21% Metropolitan Retail 107 67 68 1% Corporate and Public Sector 160 159 137 (14)% International 27 16 30 88% Total 421 346 361 4% New business margin (PVP) 1.77% 1.45% 1.32% Increased discount rate reduced overall margin
EV analysis (Rm) R1 604m R75m 207 315 -575 -16 128 -362 -124 361 1 383 -1 471 40 330 40 176 Opening EV Expected Operating Operating Value of Investment Investment Economic Exchange EV profit Change in Closing EV return experience assumption new return on variances assumption rate from non- share capital variances changes business net worth changes movements covered & dividends business |................Operational impact................| |................Market impact.................| |.............Other...............|
Analysis of return on embedded value (ROEV) Dec ROEV Dec ROEV 2014 2014 2015 2015 Rm Rm Expected return – unwind of RDR 1 331 6.9% 1 383 7.0% Operating experience variances 215 1.1% (16) (0.1)% Embedded value from new business 421 2.2% 361 1.8% Investment return on adjusted net worth 431 2.2% 315 1.6% Investment variances (495) (2.5)% 207 1.0% Non-covered (excl basis changes) 261 1.3% (332) (1.7)% Total (excl assumption changes) 2 164 11.2% 1 918 9.6% Operating assumption changes (57) (0.3)% (154) (0.8)% Economic assumption changes 115 0.6% (575) (2.9)% Exchange rate movements 4 - 128 0.7% Total return on embedded value 2 226 11.5% 1 317 6.6%
Agenda External environment Group strategy Financial results Capital management Critical focus areas
Capital strength Economic capital Rbn Net asset value as per embedded value statement 16.8 Qualifying debt 3.5 Less: net asset value of strategic subsidiaries (2.5) Less: required capital (10.1) Capital before deployment 7.7 Deployed (3.7) Interim dividend (1.0) Strategic initiatives (2.7) Capital buffer after deployment 4.0
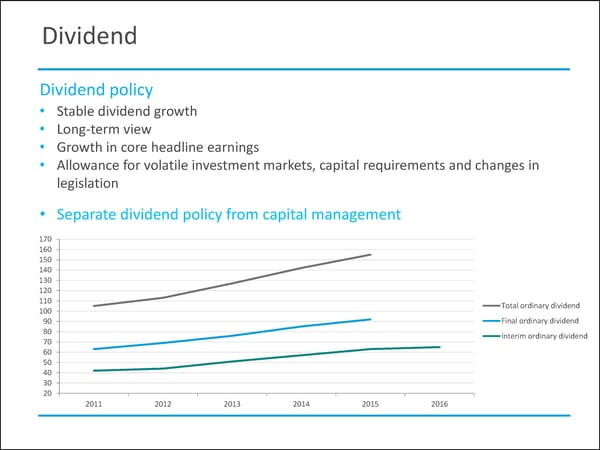
Dividend Dividend policy • Stable dividend growth • Long-term view • Growth in core headline earnings • Allowance for volatile investment markets, capital requirements and changes in legislation • Separate dividend policy from capital management 170 160 150 140 130 120 110 Total ordinary dividend 100 90 Final ordinary dividend 80 Interim ordinary dividend 70 60 50 40 30 20 2011 2012 2013 2014 2015 2016
Agenda External environment Group strategy Financial results Capital management Critical focus areas
MMI strategy map
Critical focus areas Growth Client centricity Excellence Channel Growth Client Engagement Solutions Expense optimisation • Metropolitan Retail Health • Momentum Retail Investments and Savings • Corporate and Public Sector Short-term insurance Underwriting experience Geographic Diversification • United Kingdom • India • Africa
Areas of strength Leading Excellent Extensive Diversified cash- client-centric empowerment distribution generating strategy credentials capability businesses Experienced Strong Strong Attractive management brands balance dividend sheet
Additional information
Shareholder structure as at 31 December 2015
Shareholder structure 100% KTH 90% 80% FirstRand Trusts 70% RMI 60% 50% Other local shareholders 40% Foreign 30% GEPF 20% 10% 0% % % % % % % % 31-12-2010 30-06-2011 30-06-2012 30-06-2013 30-06-2014 30-06-2015 31-12-2015
Momentum Retail Dec Dec 1 year Key aspects 2014 2015 change • Good single premium Rm Rm new business • Investment markets Total funds received 18 271 16 570 (9)% reduced fee growth New business PVP 11 817 12 673 7% • Significantly reduced mortality profits Recurring 630 627 - • Reduced contribution Single 7 883 9 063 15% from non-life business Value of new business 127 126 (1)% • Increased RdR reduced VNB by R23m Non-life profit after tax 31 (43) Life insurance profit after tax 714 748 5% Focusing on client centricity
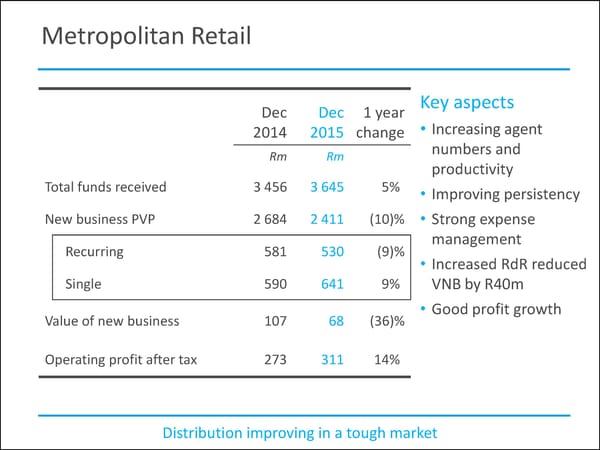
Metropolitan Retail Dec Dec 1 year Key aspects 2014 2015 change • Increasing agent Rm Rm numbers and productivity Total funds received 3 456 3 645 5% • Improving persistency New business PVP 2 684 2 411 (10)% • Strong expense Recurring 581 530 (9)% management • Increased RdR reduced Single 590 641 9% VNB by R40m Value of new business 107 68 (36)% • Good profit growth Operating profit after tax 273 311 14% Distribution improving in a tough market
Corporate and Public Sector Dec Dec 1 year Key aspects 2014 2015 change • Strong recurring Rm Rm premium growth • Appropriate client Total funds received 15 783 13 670 (13)% retention New business PVP 8 369 10 921 30% • Lower underwriting Recurring 509 862 69% experience impacted by economic factors Single 3 681 2 419 (34)% • Mix of new business Value of new business 160 137 (14)% reduced VNB Non-life profit after tax 166 181 9% Life insurance profit after tax 211 198 (6)% Steady growth
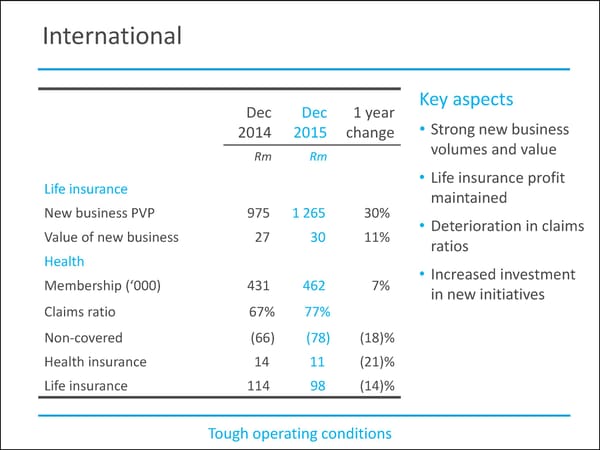
International Dec Dec 1 year Key aspects 2014 2015 change • Strong new business Rm Rm volumes and value Life insurance • Life insurance profit New business PVP 975 1 265 30% maintained Value of new business 27 30 11% • Deterioration in claims Health ratios Membership (‘000) 431 462 7% • Increased investment in new initiatives Claims ratio 67% 77% Non-covered (66) (78) (18)% Health insurance 14 11 (21)% Life insurance 114 98 (14)% Tough operating conditions
Momentum Short-term Insurance 1H2015 2H2015 1H2016 Key aspects Rm Rm Rm • Terminated unprofitable Premium income 227 279 286 channels Claims paid 160 281 245 • Improvement in premium quality Operating loss before tax (51) (131) (95) • Improving claims Policy count 53 483 56 425 52 634 and expense ratios Loss ratio 70.4% 100.7% 85.7% Combined ratio 128.4% 149.8% 135.6% Solvency ratio 34.0% 43.6% 33.9% Improving quality
Momentum Short-term Insurance Financial Indicators* F2015-Q4 F2016-Q2 F2015-Q4 F2016-Q2 35.3% 31.6% Management 102.2% 82.7% expense ratio Loss ratio Acquisition cost ratio F2015-Q4 F2016-Q2 20.3% 20.1% *compares quarterly movements of F2015-Q4 to F2016-Q2
MMI Investor relations Visit our website www.mmiholdings.com Tyrrel Murray +2721 940 5083 / 082 889 2167 tmurray@mmiholdings.co.za Natalie Amos +2721 940 6112 / 083 605 8339 namos@mmiholdings.co.za