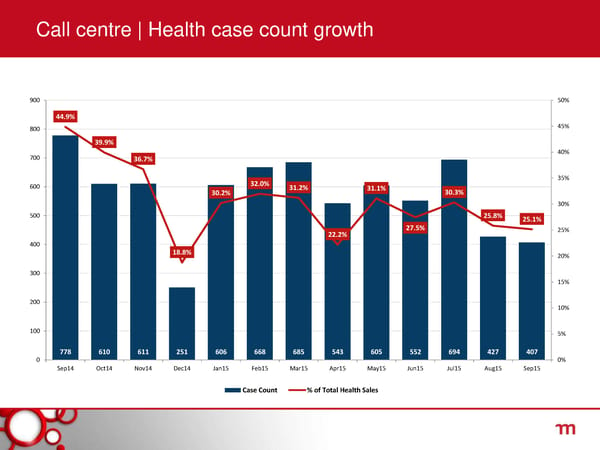
Call centre | Health case count growth 900 50% 44.9% 800 45% 39.9% 700 40% 36.7% 32.0% 35% 600 30.2% 31.2% 31.1% 30.3% 30% 500 25.8% 25.1% 22.2% 27.5% 25% 400 18.8% 20% 300 15% 200 10% 100 5% 778 610 611 251 606 668 685 543 605 552 694 427 407 0 0% Sep14 Oct14 Nov14 Dec14 Jan15 Feb15 Mar15 Apr15 May15 Jun15 Jul15 Aug15 Sep15 Case Count % of Total Health Sales
 Momentum Strategic Review Page 38 Page 40