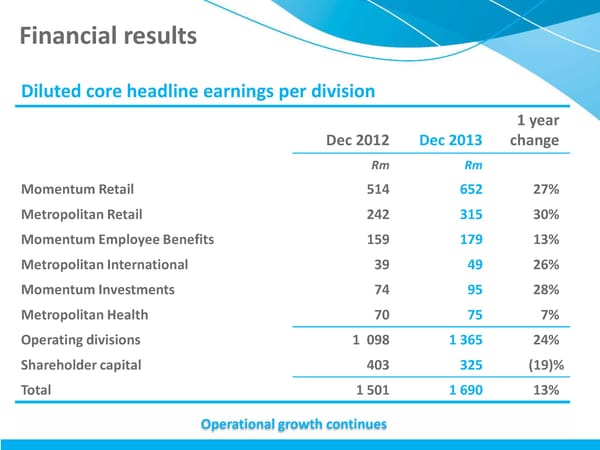
Financial results Diluted core headline earnings per division 1 year Dec 2012 Dec 2013 change Rm Rm Momentum Retail 514 652 27% Metropolitan Retail 242 315 30% Momentum Employee Benefits 159 179 13% Metropolitan International 39 49 26% Momentum Investments 74 95 28% Metropolitan Health 70 75 7% Operating divisions 1 098 1 365 24% Shareholder capital 403 325 (19)% Total 1 501 1 690 13% Operational growth continues
 MMI Holdings | Semi-Annual December 2013 Interim Report Page 5 Page 7